OpenAI Five: 95% and 2.9%
In August 2018 OpenAI showed its bot, OpenAI Five, playing against humans [1]. Before game 1 the network looked at the draft and gave itself a 95% chance to win, even though the matchup looked even to people. It won in 21:37. In game 2 the prediction was 76.2%, another win.
In game 3 the audience picked the bot’s heroes. The prediction after the draft: 2.9%. During the game it peaked at 17%, and the bot lost at 35:47.
A model can see things in a draft that even strong players miss. But notice: the 2.9% game lasted over half an hour. A bad draft doesn’t mean an instant loss. It means you have to outplay the other team.
10 years of research: from 69.8% to 58.7%
Students at Stanford, HSE (Moscow), NTU and independent teams have all tried to predict the winner from picks. Here is what they got:
| Year | Study | Matches | Picks only |
|---|---|---|---|
| 2013 | Stanford, Conley & Perry [2] | 56,691 | 69.8% |
| 2015 | UCSD, Kalyanaraman [3] | 30,426 | 69.4% |
| 2015 | Kinkade & Lim, via review [5] | — | 72.9% |
| 2017 | HSE / Yandex Data Factory, Semenov et al. [4] | 5,071,858 | AUC 0.66–0.71 |
| 2020 | NTU, Wu Hao [6] | 181,717 | 60.1% |
| 2026 | batru.gg benchmark [7] | 3,579,956 | 58.7% |
Why did the number go down? Early studies used small or filtered samples from old patches, often only high skill and without leavers. Modern benchmarks test on millions of normal games from all ranks. The batru authors say directly that much higher numbers usually mean information from the finished match leaked into the model [7]. So be careful with big claims like “81% accuracy”.
The honest result: from picks alone you can predict about 58–60 games out of 100. People decide the rest. But 58–60 is clearly more than 50, and that edge exists before anyone leaves the fountain.
Why average win rates lie
The most common mistake is looking at a hero’s overall win rate. In the batru benchmark, simply averaging the heroes’ win rates predicted the result in 52.2% of games. That is worse than “always bet on Radiant”, which gets 53.1% just from the side advantage [7] [9]. Even when the average was confident (65% or more), it was right only 56.0% of the time.
Older studies show the same. According to a 2017 review, a model built on the sum of individual win rates got 63%, while adding hero pairs, meaning synergy and counters, raised it to 72.9% [5]. In the HSE study, models that account for hero interactions (Factorization Machines and XGBoost) beat simple logistic regression [4].
What matters is not “which hero is strong” but “who plays against whom, and with whom”. A tier list answers the first question. The draft answers the second.
The draft matters more at lower ranks
The HSE study of 5 million matches split games by skill level, and the difference was clear [4]:
| Skill level | ROC AUC from picks (best model) |
|---|---|
| Normal | 0.706 |
| High | 0.670 |
| Very High | 0.660 |
ROC AUC is not the share of correct guesses. It measures how well the model separates wins from losses: 0.5 is a coin flip, 1.0 is perfect. The meaning is simple: at normal ranks the result depends more on picks. The authors explain that strong players know how to play into counters, while at lower skill people are confident on fewer heroes. If you are not high rated, the draft matters more for you than for pros.
Why the edge grows so fast
Once you add in-game data, predictions get accurate very fast. In the study by Hodge et al., a model on live ESL One Hamburg 2017 games reached up to 85% after just 5 minutes [8]. According to the 2017 review, another study got 82.23% at minute 5 [5]. A draft advantage turns into won lanes, and won lanes snowball. That is why the draft and the lanes should be looked at together.
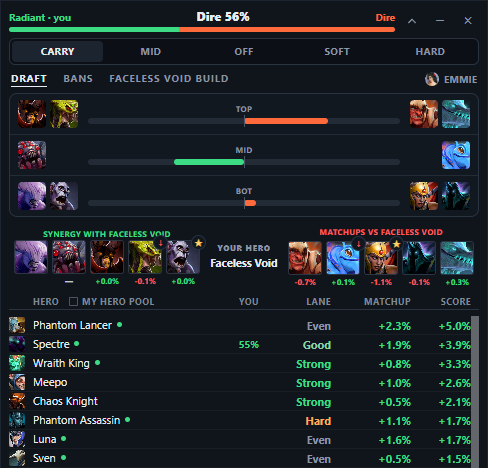
What “Dire 64%” means in Outdraft
Outdraft rates the draft using thousands of matches from the last four weeks and shows the result as a win chance. “Dire 64%” means: in similar drafts, Dire wins about 64 games out of 100. It is not a guarantee. In 36 of those 100 games, Radiant wins.
A good prediction has a simple test called calibration. If a model says “60–65%”, those games should end in a win roughly 60–65% of the time. For example, batru publishes this check for its model: predictions of 60–65% came true in 62.8% of games [7]. This is the right way to read any “draft percent”: as odds over many games, not a promise for one game.
Along with the overall percent, Outdraft shows each hero’s impact, a ⭐ on the most influential hero and a 🔻 on the weakest, plus a lane rating: Good Even Hard Very hard.
Signs of a lost draft, and what to do
- Nothing can kill the enemy’s key hero. No healing reduction, no silence, no area damage against illusions. More in “Why can’t I kill this hero?”.
- Two or three hard lanes. If almost every lane is Hard or Very hard, the enemy will have a clear lead by minute 10.
- No control or initiation. Your team can’t start a fight or catch a single hero.
If the draft really is lost: play around your strongest lane and your timing, build items against this specific enemy lineup, and don’t fight on their terms. And remember OpenAI Five’s 2.9%: even a very bad draft leaves a game to play, you just have to win it with your head.